Description:
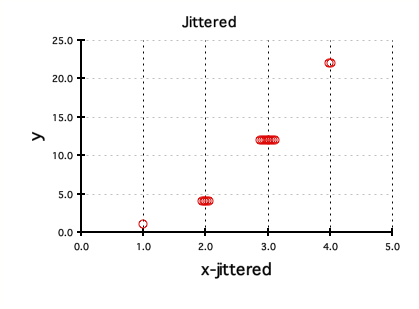
JitterCalc is a very useful Excel spreadsheet written by John Mittler, UW Dept. of Microbiology. It allows a user to jitter data along the X-axis so that data points no longer completely overlap. Without jitterin Excel overlaps data points so that they overlap (see the figure "Original" below). JitterCalc adds an offset (epsilon) to the X-axis values so they no longer overlap (see the figure "Jittered" below).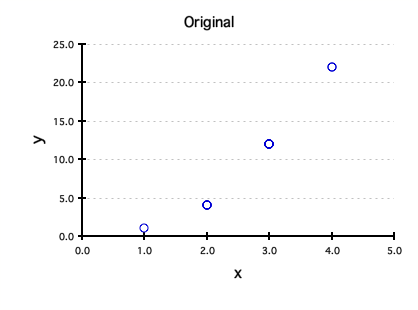
Instructions:
- Sort by x and then by y (from least to greatest) in your spreadsheet.
- Copy (x,y) data from your spreadsheet into columns A and B.
- Adjust "jitter" to change distance between jittered numbers.
- Increase "epsilon" to jitter numbers that are slightly different from each other. Be careful, however, not to make epilson too big. If you make it too big, the graph may get distorted. If in doubt, keep epsilon small.
- Copy results from Column C (yellow) into your spreadsheet.
- Do not copy "FALSE" in last row!
- Program allows you to change white cells only. To modify other parts you will need to turn off "protection" by clicking on Tools/Protection/Protect Sheet.
Notes:
This sheet can handle a maximum of 2000 points. Also, if you have >23 points with the same x value, JitterCalc will center them around the int((n+1)/2)th point instead of the true midpoint, creating a small positive bias when there is an even number of points (>=24). For example, if you have 24 spots on the same point, JitterCalc will center them around the 12th spot instead of the true mid-point between 12 and 13. As long as "jitter" is low, this approximation should be virtually imperceptible.If either of these maximums is causing difficulty, call John at (206) 732-6160 and he will tell you how to extend these limits.
This spreadsheet may be distributed free of charge. Written by John Mittler, June 16, 2001; modified Dec. 6, 2006